
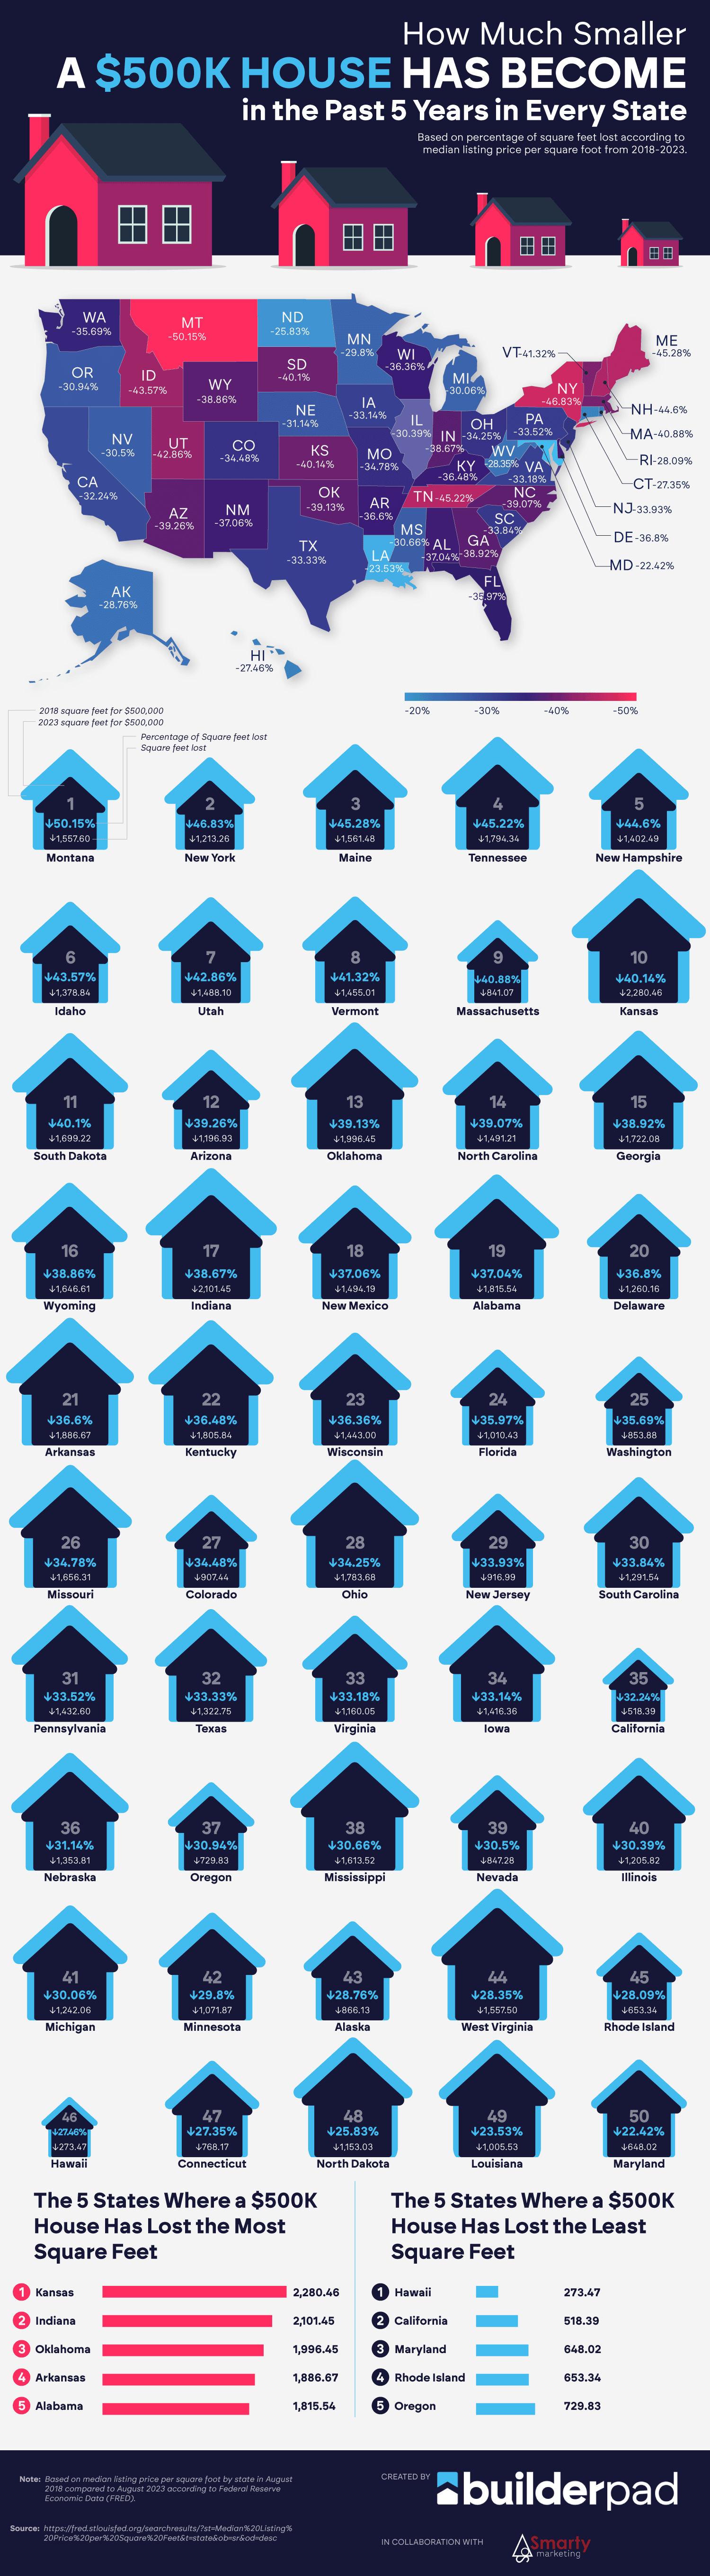
Home prices nationwide have been on the rise in recent years and many home buyers are beginning to find that the house size they can buy has decreased substantially. The 2023 housing market has been no exception as the average cost per square foot has continued to increase in every state across the country.
The team at BuilderPad.com determined which parts of the U.S. have been impacted the most by this trend of inflated house prices per square foot by ranking all fifty states on how much smaller a $500k house has become in the past five years. The ranking was based on the percentage of square feet lost according to the median listing price per square foot from 2018 to 2023.
The team found that in some states, home buyers are only able to afford half as much house with a 30-year fixed mortgage compared to the housing market prices in 2018. How much less house does a 30-year mortgage buy in your state today compared to just five years ago?
Embed This Infographic
<center><a href="https://builderpad.com/how-much-smaller-a-500k-house-has-become-in-the-past-5-years-in-every-state"><img title="How Much Smaller a $500K House Has Become in the Past 5 Years in Every State - BuilderPad.com - Infographic" src="https://builderpad.com/wp-content/uploads/2023/10/smaller-500k-house-past-5-years-6.png" alt="How Much Smaller a $500K House Has Become in the Past 5 Years in Every State - BuilderPad.com - Infographic" width="600" /></a><br /><a title="BuilderPad.com" href="https://builderpad.com/">By BuilderPad.com</a></center>Share This Post
Which State’s $500k Houses Have Lost the Highest Percentage of Square Feet?
Houses in Montana have had the largest drop in the number of square feet that can be purchased for $500k, with 50.15% of square footage lost between 2018 and 2023.
Back in 2018, the median price per square foot of a house in Montana was $161; now just five years later that price has doubled to $323 per square foot. Ever since the pandemic Montana’s housing market has surged as more people began moving there, leading to some of the highest home price increases in the US.
The 5 States With the Highest Percentage of Square Feet Lost
- Montana: 50.15%
- New York: 46.85%
- Maine: 45.28%
- Tennessee: 45.22%
- New Hampshire: 44.6%
The state that has been the least affected by the increase in U.S. housing prices is Maryland where the increase in price per square foot from $173 to $223 only led to a 22.42% decrease in the amount of square footage that half a million can buy.
The 5 States With the Lowest Percentage of Square Feet Lost
- Maryland: 22.42%
- Louisiana: 23.53%
- North Dakota: 25.83%
- Connecticut: 27.35%
- Hawaii: 27.46%
What is the Average Home Price in the US?
The average price per square foot of houses in the U.S. is $243.14 per square foot in 2023, a 61% increase from the house cost per square foot just 5 years ago. In 2018 the average cost per square foot was $150.78, allowing people in America to get far more bang for their buck when buying a new home.
How does this cost per square foot translate to the average house price in the nation? If the median square footage of single-family homes in the U.S. in 2023 is 2,191 square feet, then the average home price in the U.S. would amount to $532.7k.
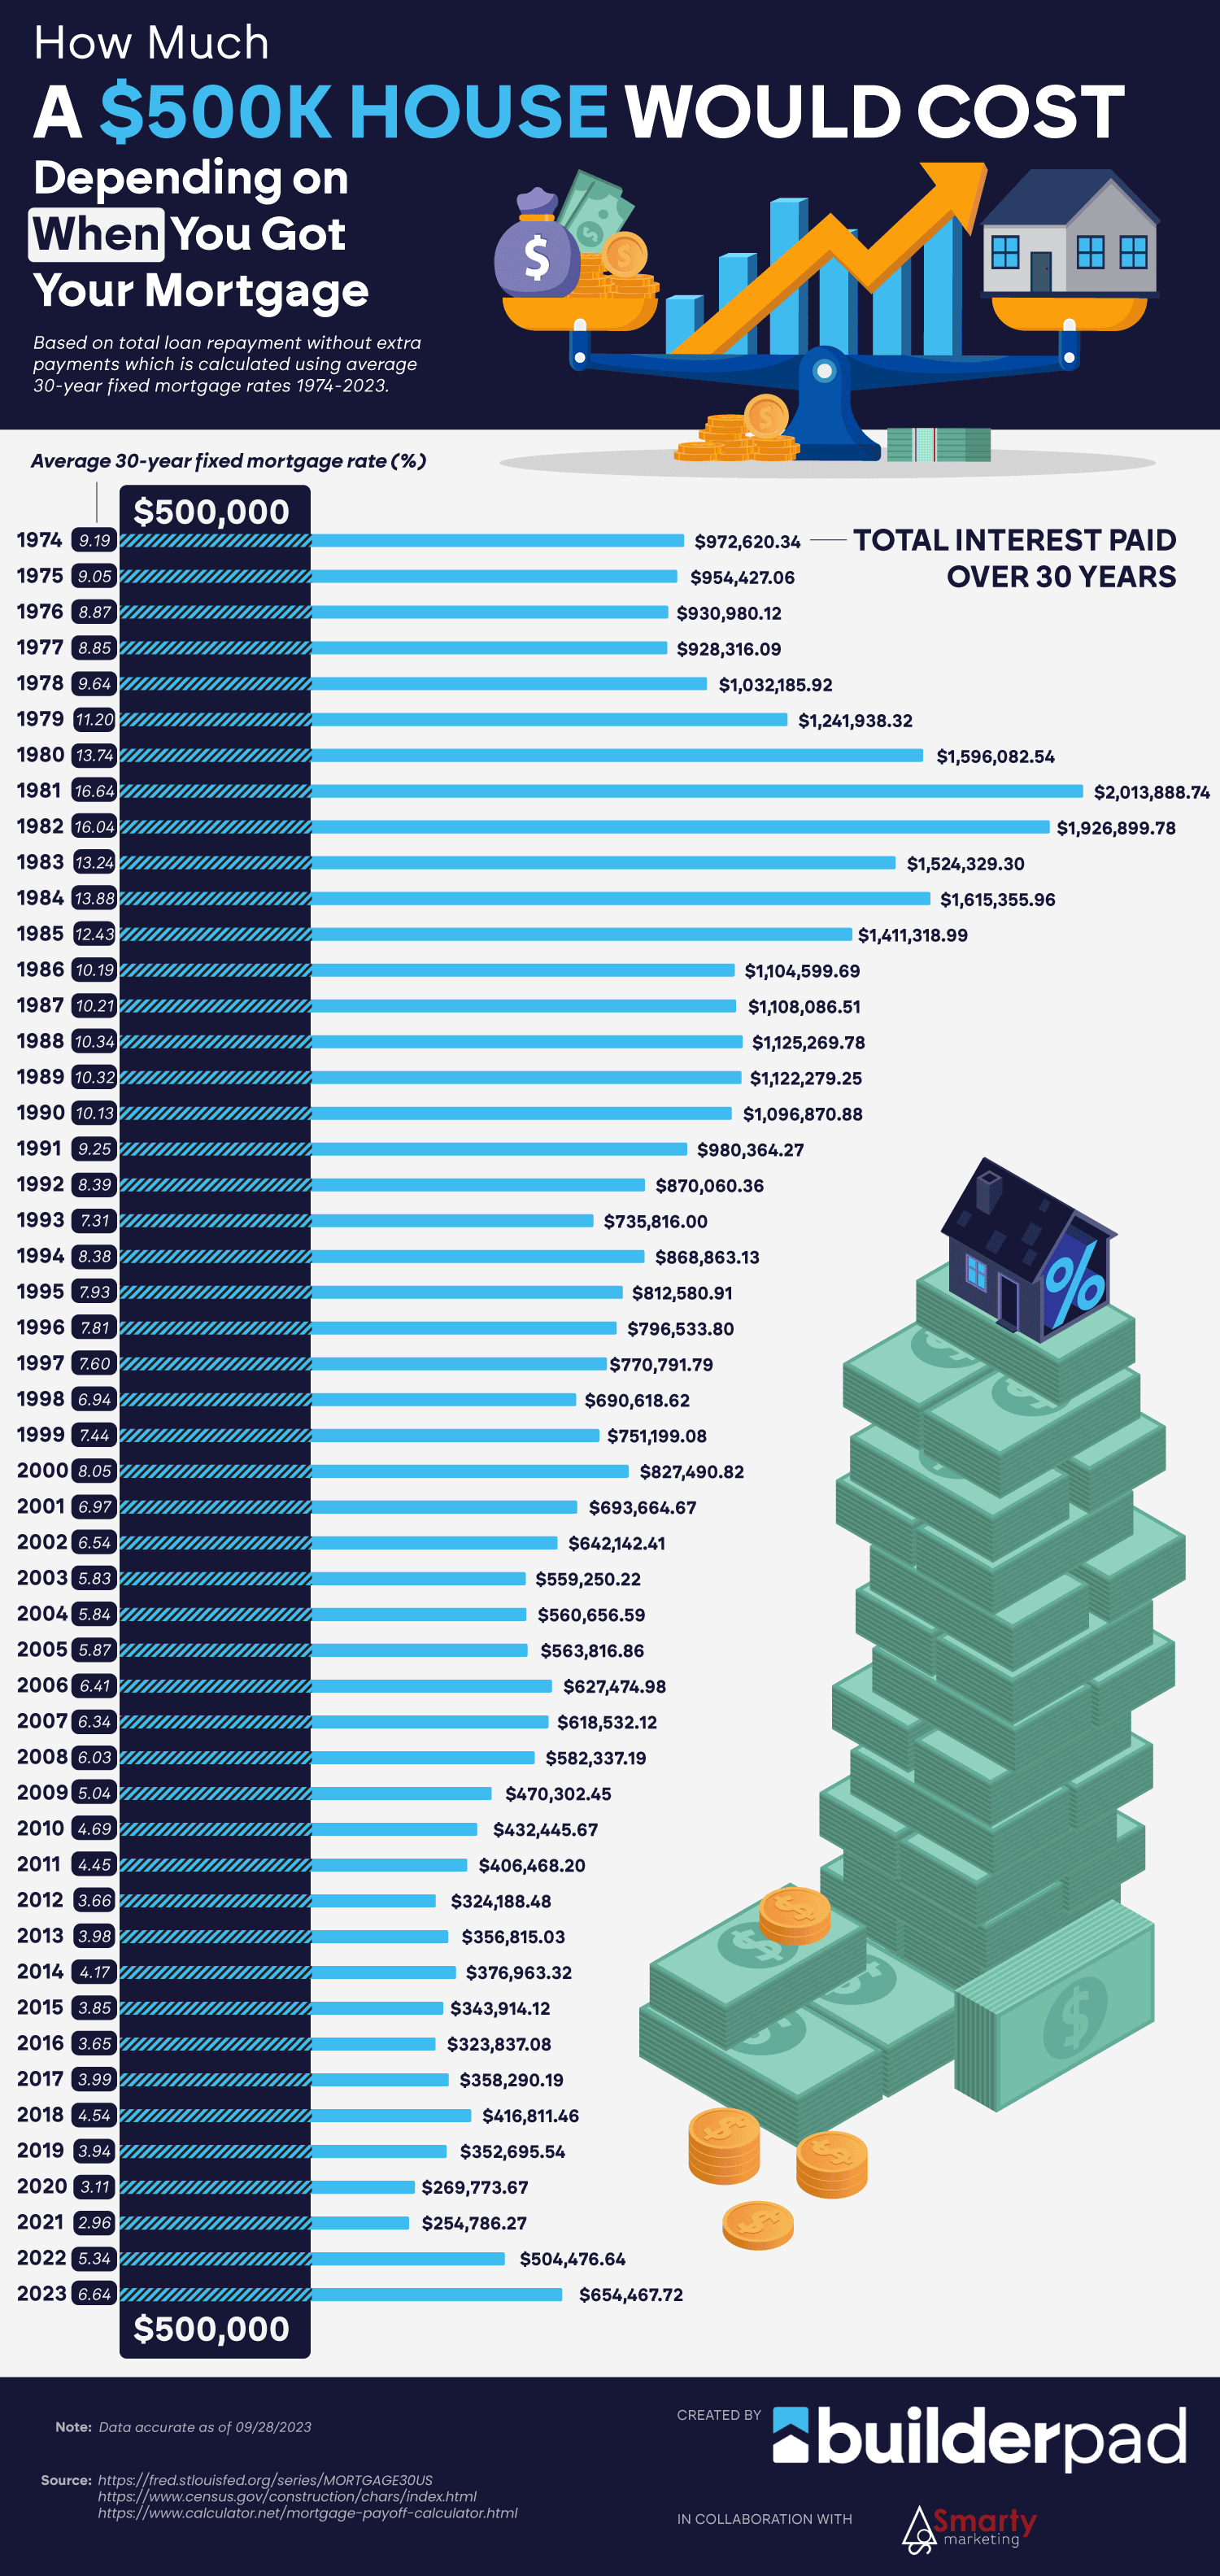
How Have Mortgage Rates Changed Over the Past 40 Years?
The BuilderPad team created an additional chart of the average 30-year fixed mortgage rates every year since 1974 to see how mortgage rates have fluctuated over time. U.S. mortgage rate records have been kept since 1971 and show how economic influences, like inflation, can affect mortgage rates at the time.
Check out the chart below to see the effect that fluctuating mortgage rates have on the total amount of interest that will be paid by the end of the 30-year mortgage period.
Embed This Infographic
<center><a href="https://builderpad.com/how-much-smaller-a-500k-house-has-become-in-the-past-5-years-in-every-state"><img title="How Much A $500K House Would Cost Depending on When You Got Your Mortgage - BuilderPad.com - Infographic" src="https://builderpad.com/wp-content/uploads/2023/10/500k-house-cost-mortgage-rates-6.png" alt="How Much A $500K House Would Cost Depending on When You Got Your Mortgage - BuilderPad.com - Infographic" width="600" /></a><br /><a title="BuilderPad.com" href="https://builderpad.com/">By BuilderPad.com</a></center>Share This Post
What is the Highest Mortgage Rate in History?
The highest mortgage rate in history was in 1981 when the average 30-year fixed mortgage rate reached a high of 16.64%. If someone took out a mortgage for a house worth half a million in 1981, they would have paid an additional two million dollars in interest alone by the end of the 30 years. That’s four times as much as the home’s value!
The 1980s saw the highest mortgage rates in history when 30-year fixed mortgage rates ranged anywhere from 10.2-16.6% throughout the decade. Below is a list of the five highest mortgage rates in the U.S. so far.
The 5 Highest Mortgage Rates in U.S. History
- 1981: 16.64%
- 1982: 16.04%
- 1984: 13.88%
- 1980: 13.74%
- 1983: 13.24%
Will Mortgage Rates Go Down in 2024?
As the end of 2023 nears, 30-year fixed mortgage rates have climbed to over 8% for the first time since 2000. This has left many home buyers wondering what next year’s mortgage rates will be and when the best time to buy a new home will be.
The good news is that mortgage rates are predicted to decrease in 2024. The National Association of Realtors and other banking organizations expect rates for a 30-year fixed mortgage to fall to the 6%-7% range by the end of next year.
The surge in U.S. home prices in 2023 has increased the demand for more homes to be built, and our app offers a modern approach to home building. Whether you’re a homebuilder, a remodeler, or a contractor our construction management app will make managing each phase of constructing a new home a seamless experience.
500K House Statistics at a Glance:
| Rank | State | Square feet lost | Percentage of square feet lost |
| 1 | Montana | 1,557.60 | -50.15% |
| 2 | New York | 1,213.26 | -46.83% |
| 3 | Maine | 1,561.48 | -45.28% |
| 4 | Tennessee | 1,794.34 | -45.22% |
| 5 | New Hampshire | 1,402.49 | -44.60% |
| 6 | Idaho | 1,378.84 | -43.57% |
| 7 | Utah | 1,488.10 | -42.86% |
| 8 | Vermont | 1,455.01 | -41.32% |
| 9 | Massachusetts | 841.07 | -40.88% |
| 10 | Kansas | 2,280.46 | -40.14% |
| 11 | South Dakota | 1,699.22 | -40.10% |
| 12 | Arizona | 1,196.93 | -39.26% |
| 13 | Oklahoma | 1,996.45 | -39.13% |
| 14 | North Carolina | 1,491.21 | -39.07% |
| 15 | Georgia | 1,722.08 | -38.92% |
| 16 | Wyoming | 1,646.61 | -38.86% |
| 17 | Indiana | 2,101.45 | -38.67% |
| 18 | New Mexico | 1,494.19 | -37.06% |
| 19 | Alabama | 1,815.54 | -37.04% |
| 20 | Delaware | 1,260.16 | -36.80% |
| 21 | Arkansas | 1,886.67 | -36.60% |
| 22 | Kentucky | 1,805.84 | -36.48% |
| 23 | Wisconsin | 1,443.00 | -36.36% |
| 24 | Florida | 1,010.43 | -35.97% |
| 25 | Washington | 853.88 | -35.69% |
| 26 | Missouri | 1,656.31 | -34.78% |
| 27 | Colorado | 907.44 | -34.48% |
| 28 | Ohio | 1,783.68 | -34.25% |
| 29 | New Jersey | 916.99 | -33.93% |
| 30 | South Carolina | 1,291.54 | -33.84% |
| 31 | Pennsylvania | 1,432.60 | -33.52% |
| 32 | Texas | 1,322.75 | -33.33% |
| 33 | Virginia | 1,160.05 | -33.18% |
| 34 | Iowa | 1,416.36 | -33.14% |
| 35 | California | 518.39 | -32.24% |
| 36 | Nebraska | 1,353.81 | -31.14% |
| 37 | Oregon | 729.83 | -30.94% |
| 38 | Mississippi | 1,613.52 | -30.66% |
| 39 | Nevada | 847.28 | -30.50% |
| 40 | Illinois | 1,205.82 | -30.39% |
| 41 | Michigan | 1,242.06 | -30.06% |
| 42 | Minnesota | 1,071.87 | -29.80% |
| 43 | Alaska | 866.13 | -28.76% |
| 44 | West Virginia | 1,557.50 | -28.35% |
| 45 | Rhode Island | 653.34 | -28.09% |
| 46 | Hawaii | 273.47 | -27.46% |
| 47 | Connecticut | 768.17 | -27.35% |
| 48 | North Dakota | 1,153.03 | -25.83% |
| 49 | Louisiana | 1,005.53 | -23.53% |
| 50 | Maryland | 648.02 | -22.42% |
The 5 States Where a $500K House Has Lost the Most Square Feet
| Rank | State | Square feet lost from 2018 to 2023 |
| 1 | Kansas | 2,280.46 |
| 2 | Indiana | 2,101.45 |
| 3 | Oklahoma | 1,996.45 |
| 4 | Arkansas | 1,886.67 |
| 5 | Alabama | 1,815.54 |
The 5 States Where a $500K House Has Lost the Least Square Feet
| Rank | State | Square feet lost from 2018 to 2023 |
| 1 | Hawaii | 273.47 |
| 2 | California | 518.39 |
| 3 | Maryland | 648.02 |
| 4 | Rhode Island | 653.34 |
| 5 | Oregon | 729.83 |
How Much a $500K House Would Cost Depending on When You Got Your Mortgage
| Year | Average 30-year fixed mortgage rate (%) | Total loan repayment without extra payments | Total interest paid over 30 years |
| 1974 | 9.19 | $1,472,620.34 | $972,620.34 |
| 1975 | 9.05 | $1,454,427.06 | $954,427.06 |
| 1976 | 8.87 | $1,430,980.12 | $930,980.12 |
| 1977 | 8.85 | $1,428,316.09 | $928,316.09 |
| 1978 | 9.64 | $1,532,185.92 | $1,032,185.92 |
| 1979 | 11.20 | $1,741,938.32 | $1,241,938.32 |
| 1980 | 13.74 | $2,096,082.54 | $1,596,082.54 |
| 1981 | 16.64 | $2,513,888.74 | $2,013,888.74 |
| 1982 | 16.04 | $2,426,899.78 | $1,926,899.78 |
| 1983 | 13.24 | $2,024,329.30 | $1,524,329.30 |
| 1984 | 13.88 | $2,115,355.96 | $1,615,355.96 |
| 1985 | 12.43 | $1,911,318.99 | $1,411,318.99 |
| 1986 | 10.19 | $1,604,599.69 | $1,104,599.69 |
| 1987 | 10.21 | $1,608,086.51 | $1,108,086.51 |
| 1988 | 10.34 | $1,625,269.78 | $1,125,269.78 |
| 1989 | 10.32 | $1,622,279.25 | $1,122,279.25 |
| 1990 | 10.13 | $1,596,870.88 | $1,096,870.88 |
| 1991 | 9.25 | $1,480,364.27 | $980,364.27 |
| 1992 | 8.39 | $1,370,060.36 | $870,060.36 |
| 1993 | 7.31 | $1,235,816.00 | $735,816.00 |
| 1994 | 8.38 | $1,368,863.13 | $868,863.13 |
| 1995 | 7.93 | $1,312,580.91 | $812,580.91 |
| 1996 | 7.81 | $1,296,533.80 | $796,533.80 |
| 1997 | 7.60 | $1,270,791.79 | $770,791.79 |
| 1998 | 6.94 | $1,190,618.62 | $690,618.62 |
| 1999 | 7.44 | $1,251,199.08 | $751,199.08 |
| 2000 | 8.05 | $1,327,490.82 | $827,490.82 |
| 2001 | 6.97 | $1,193,664.67 | $693,664.67 |
| 2002 | 6.54 | $1,142,142.41 | $642,142.41 |
| 2003 | 5.83 | $1,059,250.22 | $559,250.22 |
| 2004 | 5.84 | $1,060,656.59 | $560,656.59 |
| 2005 | 5.87 | $1,063,816.86 | $563,816.86 |
| 2006 | 6.41 | $1,127,474.98 | $627,474.98 |
| 2007 | 6.34 | $1,118,532.12 | $618,532.12 |
| 2008 | 6.03 | $1,082,337.19 | $582,337.19 |
| 2009 | 5.04 | $970,302.45 | $470,302.45 |
| 2010 | 4.69 | $932,445.67 | $432,445.67 |
| 2011 | 4.45 | $906,468.20 | $406,468.20 |
| 2012 | 3.66 | $824,188.48 | $324,188.48 |
| 2013 | 3.98 | $856,815.03 | $356,815.03 |
| 2014 | 4.17 | $876,963.32 | $376,963.32 |
| 2015 | 3.85 | $843,914.12 | $343,914.12 |
| 2016 | 3.65 | $823,837.08 | $323,837.08 |
| 2017 | 3.99 | $858,290.19 | $358,290.19 |
| 2018 | 4.54 | $916,811.46 | $416,811.46 |
| 2019 | 3.94 | $852,695.54 | $352,695.54 |
| 2020 | 3.11 | $769,773.67 | $269,773.67 |
| 2021 | 2.96 | $754,786.27 | $254,786.27 |
| 2022 | 5.34 | $1,004,476.64 | $504,476.64 |
| 2023 | 6.64 | $1,154,467.72 | $654,467.72 |